Read your spray chart
What the dots, their colours and the four zones are telling you — and why a zone's average runs so far above the one on the rest of your stats.
A spray chart is one dot per at-bat that had a location tapped on the field while it was being recorded, drawn on that same field. Nothing else puts a dot there, so an at-bat with no location is on no chart at all — which is why a game typed in from a box score is in every number you have and in none of the pictures.
A dot's colour is the outcome of that at-bat and nothing else — not how hard it was hit, not when, not who was pitching. Green is a single, blue a double, purple a triple, gold a home run, red an out, and cyan a fielder's choice or reaching on an error. Each dot also carries its own short code in the middle of it — 1B, 2B, 3B, HR, GO, FO and so on — so the colour and the word always agree, and the legend along the top of the chart on the website and under it on the phone is drawn from exactly those six colours rather than from a list somebody typed, which is what keeps it honest in dark mode. The only extra mark is a faint ring around a home run: emphasis on the dot everybody looks for, not a seventh colour.
The chart opens showing your hits, not everything, so the first thing worth doing is deciding which slice you are looking at. All is every ball that was put in play. Outs is the ones you were retired on, counting a sacrifice fly or a sacrifice bunt as an out because the fielder caught it — even though neither dents your average. A fielder's choice and reaching on an error are in neither Hits nor Outs, because the batter reached base without a hit; the only way to see those two cyan dots is All.
On your phone
- Open the Stats tab. The Spray Chart row sits under your totals with the number of tracked locations beneath it, and it is only there once something has a location at all. Tap it.
- The chart fills the screen and opens on Hits. All, Hits and Outs is the segmented control under it, and the line below that is the count of dots on the field.
- Zones is the button beside that control. It swaps the dots for four shaded wedges and locks the control to All, because a zone's rates are over every ball in play. Turn it off and you are back on the view you left. There is no Heat view on the phone — that one is the website's.
- Tap a dot and a card appears under the chart with the outcome, how it came off the bat, the opponent and date, and the RBIs; the × dismisses it. With Zones on there are no dots to tap.
- The Filters button above the chart narrows it the same way it narrows the Stats tab — the two screens share one set of filters, so what you set on either is what the other opens with.
- Under the chart in Zones: "Zones use every ball in play. AVG and SLG are for balls hit to each zone, a batted-ball rate, not a season batting average.", plus a line saying how many at-bats had no location when any did.
On the web
- Open Performance in the sidebar and scroll to the block headed Spray Chart. The season it is showing and a count sit beside the heading — "12 hits", say — and that count is how many dots are actually on the field, not how many at-bats the slice has.
- The segmented control on the right is All, Hits and Outs, and it starts on Hits. Switching it changes the dots, the heat and the count. It locks to All while Zones is on, and comes back to where you left it.
- The three buttons on the left switch the picture itself: Spray draws the dots, Heat replaces them with a blurred green cloud showing where the balls cluster, and Zones replaces them with four shaded wedges. You only ever get one of the three — two pictures of one slice over each other read as a bug.
- Click a dot to open a card under the chart: the outcome and how it came off the bat, who you were playing and when, and any RBIs. Click bare grass to dismiss it. Dots are only clickable in the Spray view, because the other two draw none.
- Switch to Zones and read the line under the chart: "Zones use every ball in play. AVG and SLG are for balls hit to each zone, a batted-ball rate, not a season batting average." When some of the at-bats in the slice have no location, a second line underneath says how many.
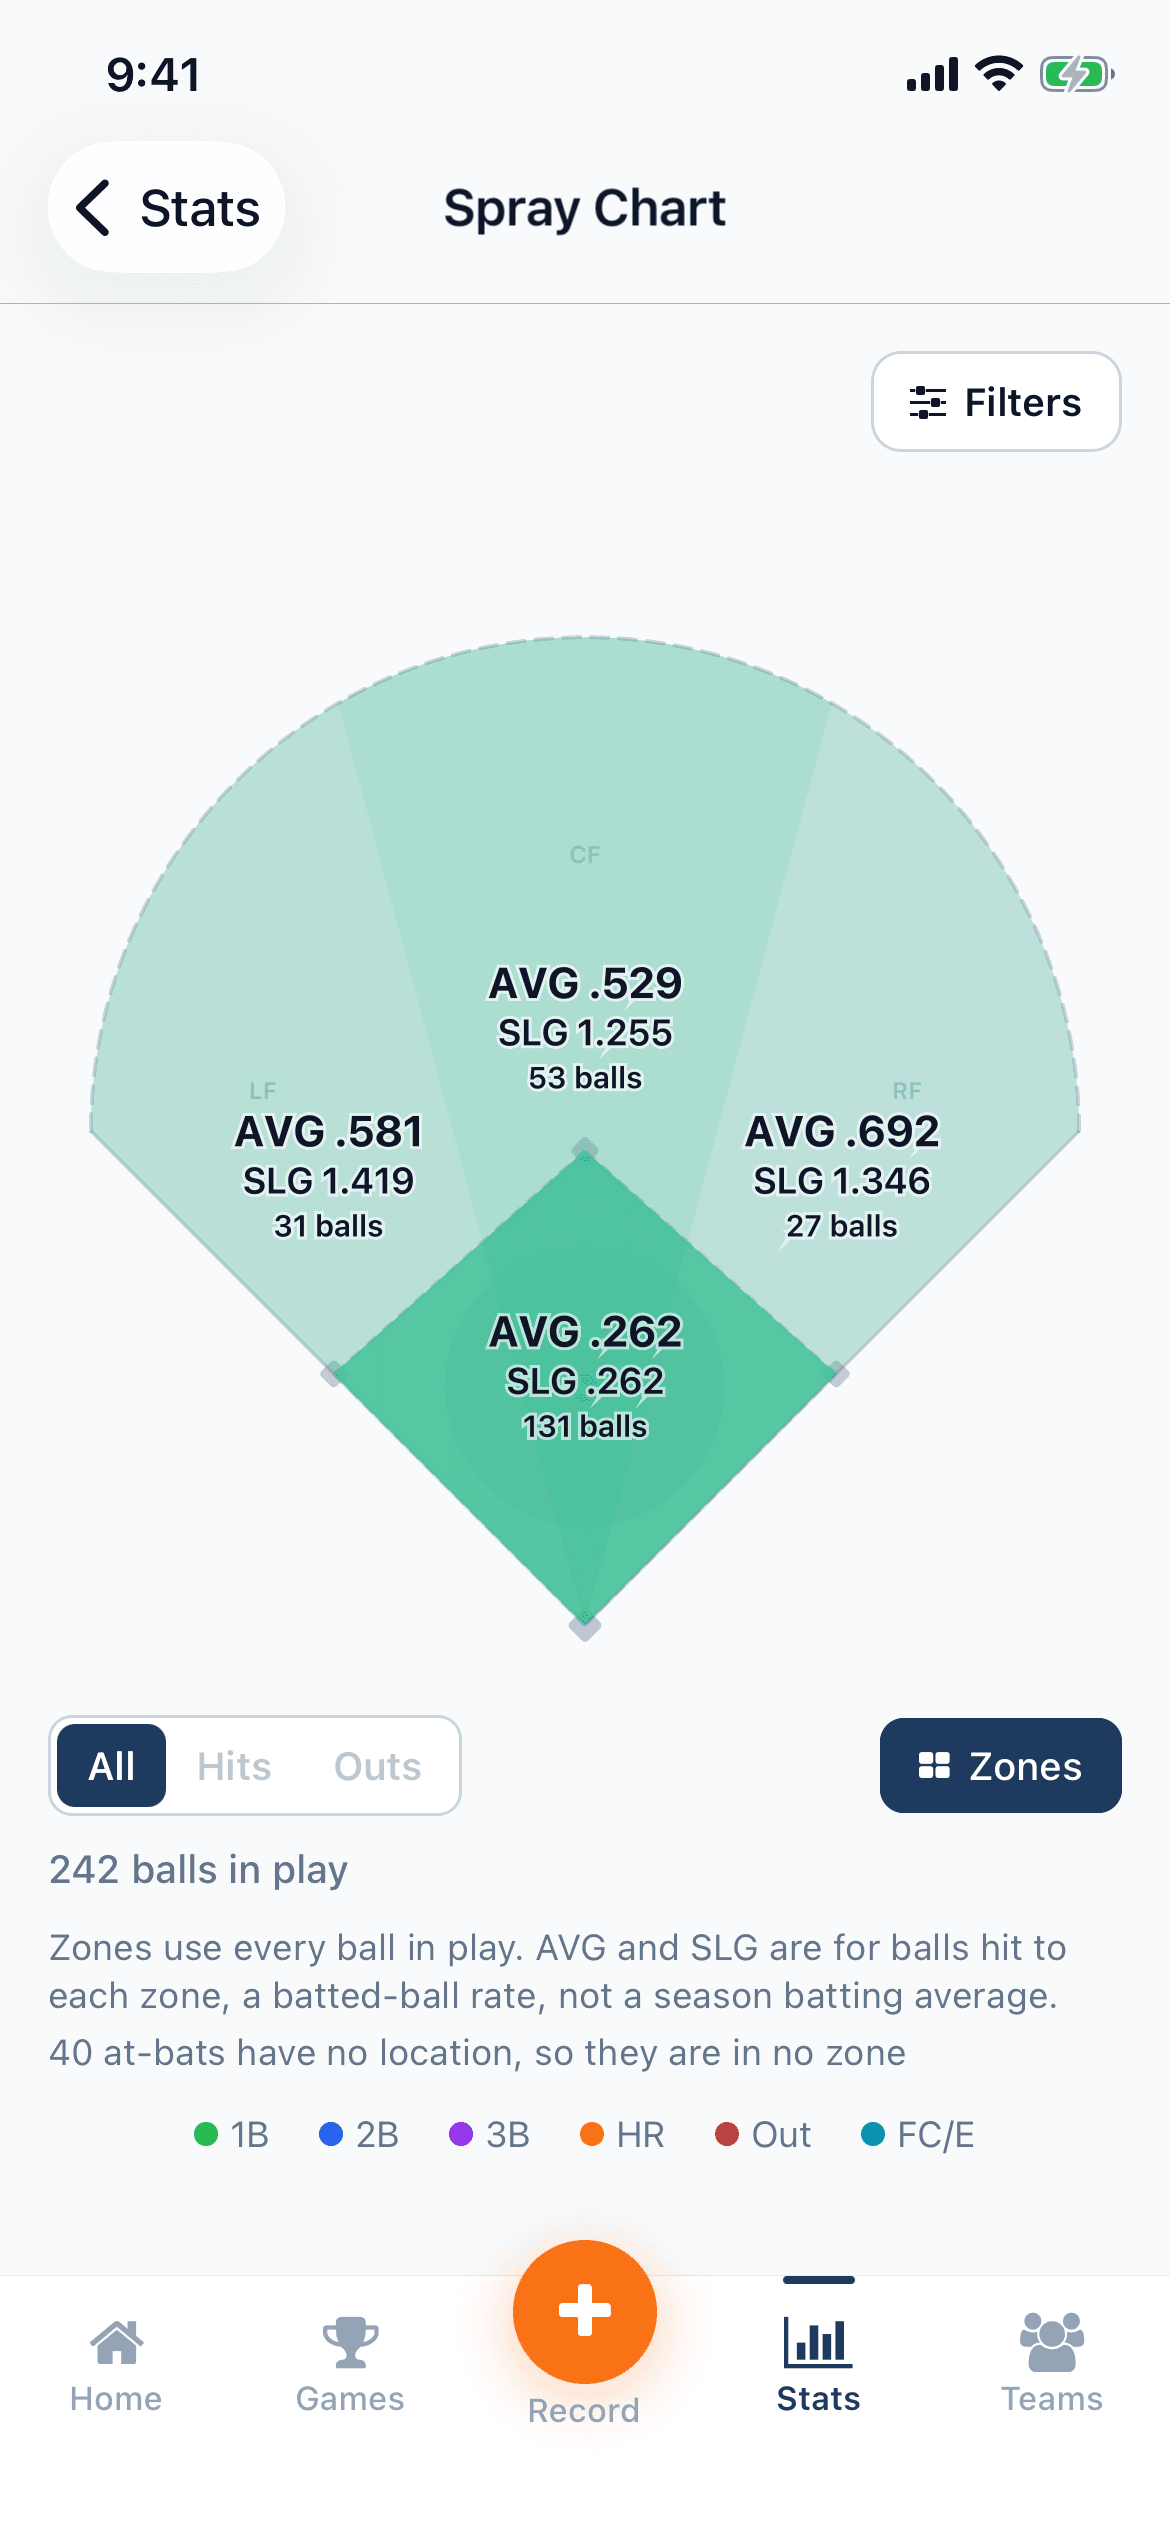
Zones splits the field into four, and the four are the infield, left field, centre field and right field. The infield is the diamond itself — the quadrilateral between home, first, second and third — and it is tested first, so a ball that landed between the bases is infield whichever side it was on. Everything outside the diamond is sorted by the angle it left home plate at, into three equal thirds of fair territory: left field from the foul line to a third of the way across, centre field the middle third, right field the rest. That means depth decides only one thing, infield or not; a blooper that dropped just behind the shortstop is in left field, the same as one off the fence.
Each wedge carries three lines — AVG, then SLG, then the number of balls hit there. The green shading is volume and only volume: the zone you hit to most is the darkest, and a zone with nothing in it is not shaded at all. It is deliberately not tinted by average, because then a single ball you happened to hit for a double would be the brightest thing on the field.
The one number on that overlay people mistrust is the AVG, and it is right — it is just not the average they are comparing it against. Only a ball in play has a location, so a zone's AVG is worked out over the at-bats that ended with a ball hit there and nothing else: every strikeout you have is in no zone, which is most of the gap. A zone with balls in it but no official at-bats — all sacrifices, say — prints an em dash rather than .000, because nought-for-nought is not a zero. And at-bats with no location are counted in their own line under the chart instead of being dropped, since every rate above that line is worked out as though they never happened.
Your chart is not the only one. The game's own page draws just that game's at-bats, a team's page draws the whole roster's, and a card you share carries a chart of its own — drawn from the same locations, but deliberately not coloured like this one.
Everything above obeys whatever the stats filters are set to, on both apps, so "my spray chart" is really "my spray chart for this slice" — one season, one opponent, one field, or the lot.
Not sure what a stat on this screen means? The glossary explains it.
Related guides
Still stuck?
Try the rest of the guides or the support page. Sending feedback from inside the app reaches a real person.